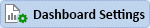
 to
see the Dashboard Settings Tab in Facilities. Users can also go to the
Preferences Tab and click on the Facilities button
to
see the Dashboard Settings Tab in Facilities. Users can also go to the
Preferences Tab and click on the Facilities button  .
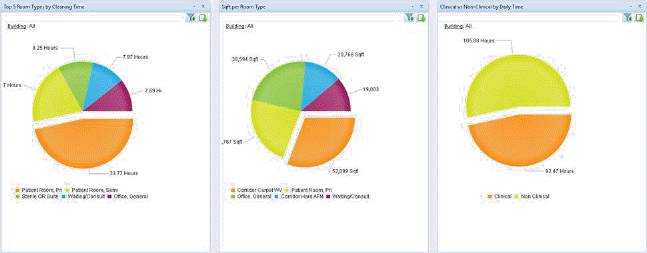
.Each section referenced in Dashboard Graphs (Buildings and Rooms, Daily Assignments, etc.) contain a list of graphs available to view. Below are the procedures for updating graphs available in the Dashboard:
1. Click
on the Dashboard Settings button to
see the Dashboard Settings Tab in Facilities. Users can also go to the
Preferences Tab and click on the Facilities button .
2. If there are multiple facilities, select and click one of the facilities in the list.
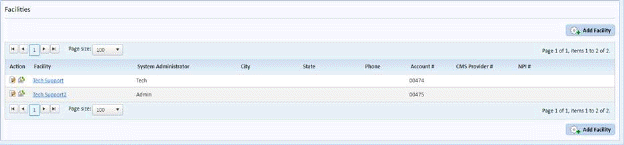
3. In the selected facility, click on the Dashboard Settings tab:
4. The Dashboard Settings tab allows the user to expand a section as shown in the figure below:

5. From here, select the graphs you want enabled/viewable in the Dashboard.
6. Click on the Save button to save the changes to your settings.
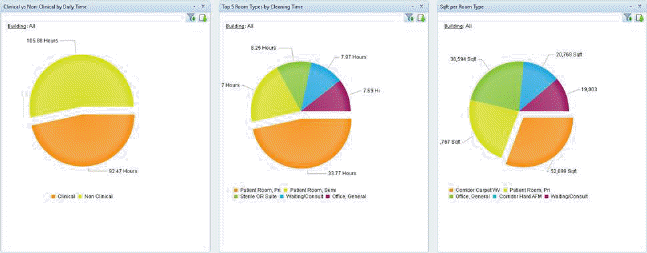
Users can also drag and drop the graphs to follow a particular order of their choosing as shown in the figures below:
Notice the graph in the 3rd column is moved to the first column as shown in the figure below: