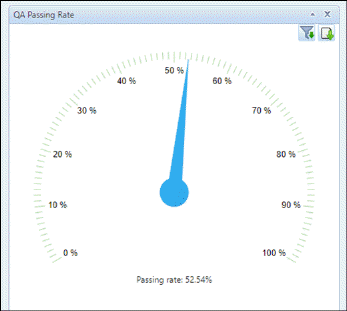
- When Graph By = Region, QA Passing Rate data is shown for all the regions in specific system.
- When Graph By = Facility, QA Passing Rate data is shown for all the facilities in the selected region.
- When specific facility is selected then graph shows data for selected facility.
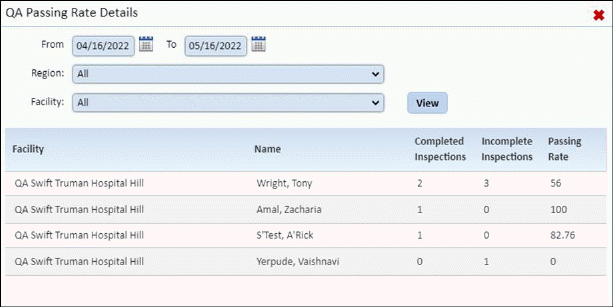
- By clicking the chart, more details are shown in popup with following fields: Facilty, Name, Completed Inspections, Incomplete Inspections, and Passing Rate.