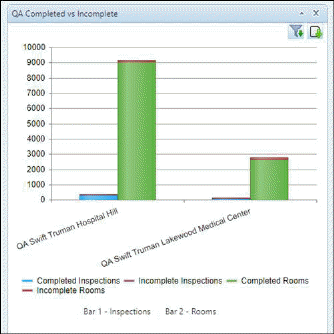
- When Graph By = Region, QA Completed vs Incomplete data (rooms and inspections) data is shown for all the regions in specific system.
- When Graph By = Facility, QA Completed vs Incomplete data (rooms and inspections) data is shown for all the facilities in the selected region.
- When specific facility is selected then graph shows data for selected facility.
- By clicking the chart, more details are shown in popup with following fields: Facility, Name, Completed Inspections, Incomplete Inspections, Completed Room, Incomplete Rooms, and Average.
