In ES Optimizer, data is presented in three ways: Lists, Forms, and Reports.
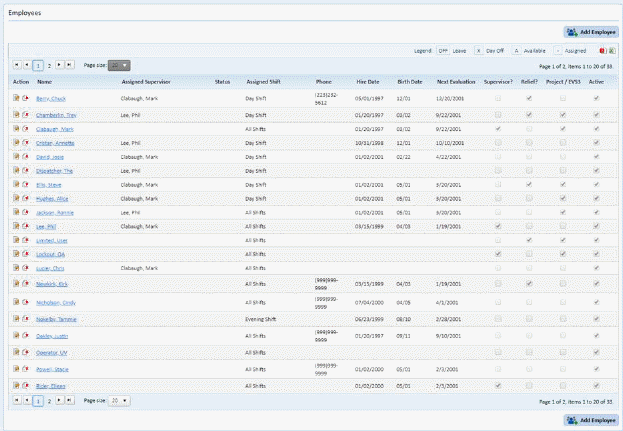
Lists show the current collection of data in the facility. They can be employees, rooms, dates, etc. Below is a sample of a list (of employees):
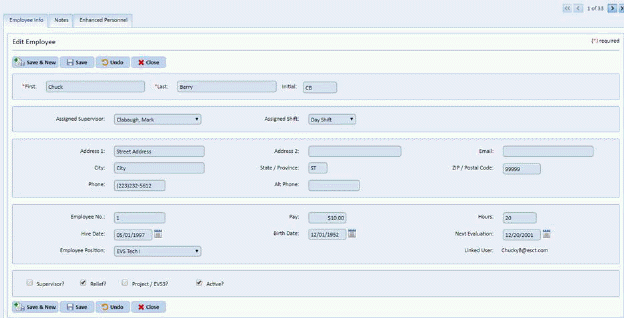
Forms are used for entering data. The data can be certain details about employees (phone numbers, addresses, etc.) or shifts (start times, break times, etc.). Below is a sample of a form:
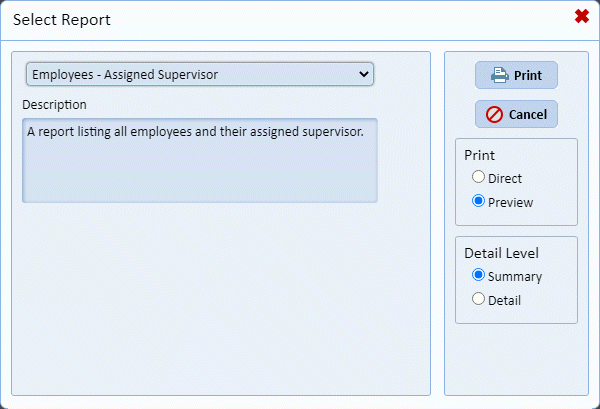
Reports are used for compiling the data from lists and forms into various formats like charts and graphs. Reports make data presentation more readable for the user. Below is a sample Print Report box:
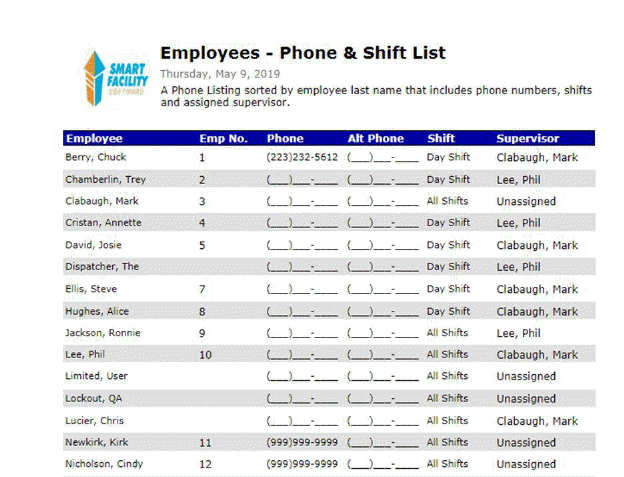
Below is a sample of a report in preview mode: