 opens the Dashboard Module:
Dashboard is a module designed to provide Admin Users a quick summary of their data in a graphical format. For example, square footage or inspection counts are shown a graph to make the data summaries easier to review.
Clicking on the Dashboard button opens the Dashboard Module:
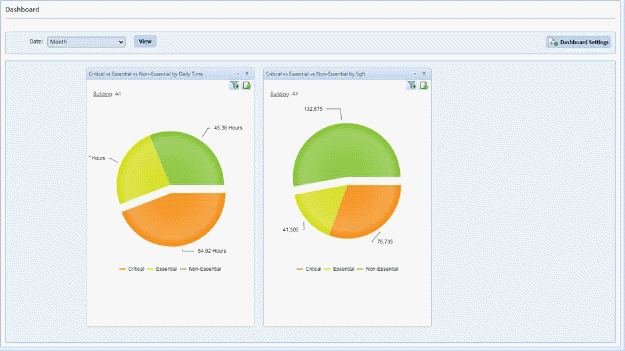
NOTE: Dashboard graphs are configured at a facility level. If an account has multiple facilities, each facility will have its respective data reflected in the Dashboard graphs.