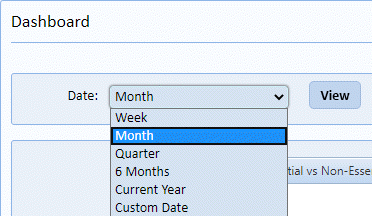
Users can and should customize the graphs they can view. The Dashboard Module has a global filter as shown in the figure below:
Many of the graphs also have filters, just click on the
Filter icon and you will see filter
options as shown in the sample figure below:
and you will see filter
options as shown in the sample figure below:
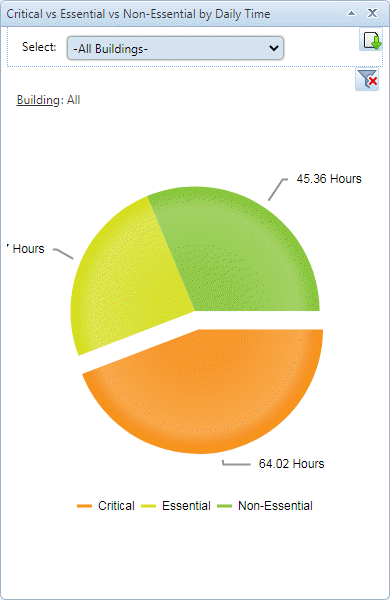
NOTE: Some graphs do not have the necessary data in the system to allow filtering.
NOTE: The Export Graph icon allows downloading the graph in .png
format for inclusion in a report or email.
allows downloading the graph in .png
format for inclusion in a report or email.