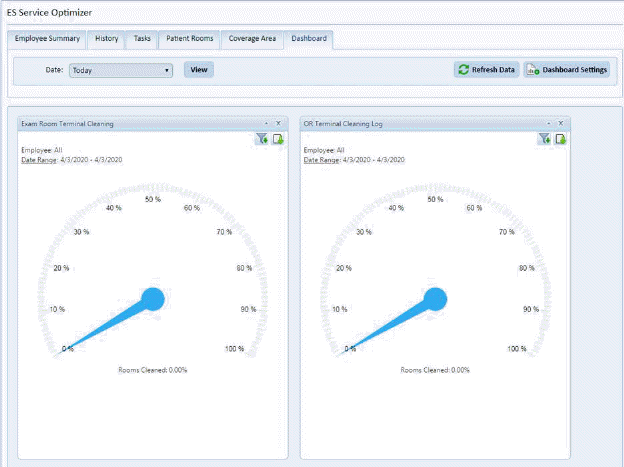
The Dashboard Tab works like the original Dashboard of ES Optimizer. This tab shows graphs relating to ES Service Optimizer.
The Date filter 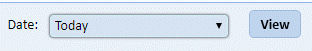 allows for timeline selection that the
graphs display. Available options are: Today, Yesterday, Week,
Month, Quarter, 6 Months, Current Year or Custom Date Range.
allows for timeline selection that the
graphs display. Available options are: Today, Yesterday, Week,
Month, Quarter, 6 Months, Current Year or Custom Date Range.
The graphs also allow individual filtering and download of
resulting graphic produced via the icons(as applicable) located in the top right
corner of the graph  .
.
The Dashboard Settings  button allows for customization of the graphs
displayed as shown below:
button allows for customization of the graphs
displayed as shown below:
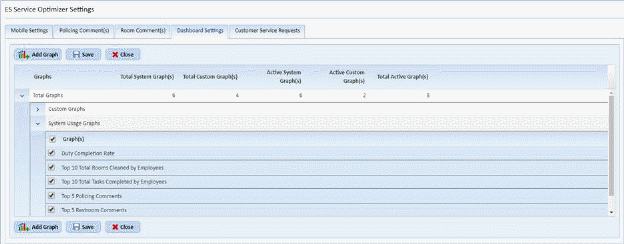
Each user can check or uncheck the graphs they wish to
display in the dashboard and then apply using the Save  button.
When you are finished click the Close button .
.
Note: To Add a graph see ES Service Optimizer Settings Form