- By default, rolling 30 days data is shown and max available date range is 12 months.
- Graphs can be filtered by regions and facilities.
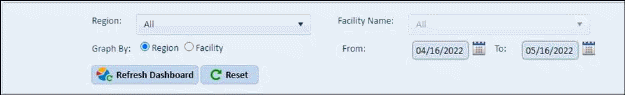
- Graph inner filter are available depending upon the graph data.
- Graph inner filter is applicable to a graph only and it overrides global dashboard filter.
- On clicking the graph, more details are shown in popup.
- “Refresh data” button fetches latest data from web for specific system/regions.
- Insight Panel dashboard Order changes
•User can set graphs order by drag-dropping the individual graphs.
•The set graph order remains intact until modified by the user.
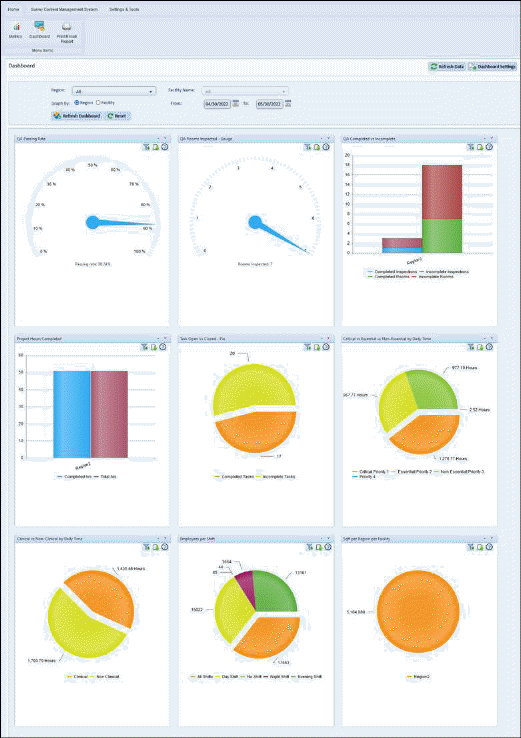
Currently following web graphs are available
- Buildings and Rooms
o Clinical vs Non-Clinical by Daily Time
o Clinical vs Non-Clinical by Sqft
o Critical vs Essential vs Non-Essential by Daily Time
o Sqft per region per Facility
- Employees
o Employees per Shift
- ES Service Optimizer
o Patient Rooms Clean Types
o Rooms Cleaning By Sqft
o Total Rooms Cleaned per region per facility
- Project Assignment
o Project Hours Completed
- Quality Management
o QA Completed vs Incomplete
o QA Passing Rate
o QA Rooms Inspected - Gauge
o QA Rooms Inspected - Bar
- Task Management
o Task Open Vs Closed – Pie
o Task Open Vs Closed - Bar